"Learn Everything About Your Services with Jaeger and Linkerd"
We’ve talked a bit about Linkerd in a previous post, and now, to expand our knowledge about service mesh even further, let’s discuss an interesting concept that we’ll explore more carefully in other articles. But here we’ll have a practical example! Tracing.
Tracing#
Tracing is one of the elements of the triad that makes up what we’ll address later as Observability, but for now let’s focus on this aspect.
Tracing is the ability to follow a request from end to end, checking the order of service calls, the payload sent and received by each one, the responses from each service, and also how long each request took.
Implementing simple tracing in an application is not a complex task—we just need to log everything we send and receive. However, there’s another concept called deep tracing or distributed tracing that’s specifically designed for distributed applications.
And that’s where things start getting complicated…
Deep Tracing#
Deep Tracing is the name given to the technique of linking logs from one call to another, forming a timeline of what was done. Each log is called a span, and a single request can trigger multiple spans, especially when we’re dealing with microservices calling each other in sequence.
To put it simply, what Deep Tracing does is add a header to the initial request called a Request ID. Each implementation of the technique has its own name for this. With each new request, this ID is passed along, and combined with the request timestamp, this information is used to build a history of everything that was done.
The problem is that to implement all of this manually, we have to:
- Have a very good understanding of our application
- Intercept all HTTP calls and add a header to each one
Which isn’t an easy task, so tools like Jaeger exist.
Jaeger#
Jaeger is an open source tool hosted by CNCF that exists specifically to avoid the complexity of deploying and implementing all the moving parts that make up a distributed tracing system.
It also uses Open Telemetry, a project that aims to simplify application telemetry through a standard set of tools for metric collection.
Jaeger is written in Golang, which makes it very fast and useful for systems that are distributed or have a complex mesh of services. Know what works really well with this architecture? Linkerd!
Linkerd and Jaeger#
Service Mesh and Observability are concepts that go hand in hand, but you don’t always have the ability to implement both easily. That’s where both Linkerd and Jaeger shine individually, but in addition to being amazing on their own, they’re even better together.
Using Linkerd with Jaeger is an excellent way to get all possible information and metrics from your application quickly and practically, especially since Linkerd itself supports add-ons that include both Jaeger and OpenCensus Collector, a metrics collection tool.
But enough concepts! The best way to explain what Jaeger is through practice! So let’s get to work!
Applying Tracing#
To start, I’ll assume you already have the cluster created and Linkerd installed. If you haven’t installed everything yet, go back to the previous article and follow the tutorial to the end.
With our cluster configured and Linkerd already installed, let’s start by installing the all-in-one configuration, which provides a single image containing all the elements needed for Jaeger tracing to work smoothly.
To install this configuration, we’ll create a new file called config.yaml and put the following content in it:
tracing: enabled: trueThen, we’ll run a Linkerd command to add the new add-on. In the folder where you created the new file, run the following command:
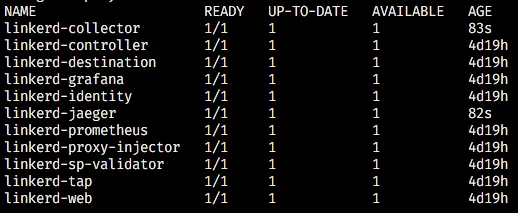
linkerd upgrade --addon-config config.yaml | kubectl apply -f -Once we’re done, we should have two new deployments, one called linkerd-collector and another called linkerd-jaeger in the linkerd namespace:
Annotations#
To detect changes and start performing tracing, Linkerd uses two new annotations in our deployments. Whenever we need to make this change, we’ll include these lines along with the linkerd.io/inject: enabled annotation, like this:
spec: template: metadata: annotations: linkerd.io/inject: enabled config.linkerd.io/trace-collector: linkerd-collector.linkerd:55678 config.alpha.linkerd.io/trace-collector-service-account: linkerd-collectorInstrumentation#
Tracing, unlike most DevOps techniques, requires instrumentation in the application. That is, we need to manually insert the metrics collector code into our system so it can identify and add the headers and trace ID.
This can be done manually in our application using Node through this package, but to keep the process simpler, we’ll use Linkerd’s default application for testing.
First, we install the application with the command:
kubectl apply -f https://run.linkerd.io/emojivoto.ymlThen we run the following command to include the annotation we showed earlier:
kubectl -n emojivoto patch -f https://run.linkerd.io/emojivoto.yml -p 'spec: template: metadata: annotations: linkerd.io/inject: enabled config.linkerd.io/trace-collector: linkerd-collector.linkerd:55678 config.alpha.linkerd.io/trace-collector-service-account: linkerd-collector'We wait for the deployment to finish. You can run the following command to track it:
kubectl -n emojivoto rollout status deploy/webFinally, let’s enable tracing by setting a new environment variable in the deployment with the following command:
kubectl -n emojivoto set env --all deploy OC_AGENT_HOST=linkerd-collector.linkerd:55678Exploring Jaeger#
We’ll make sure our implementation worked when we run the linkerd dashboard command and see the Jaeger icon next to our namespaces:

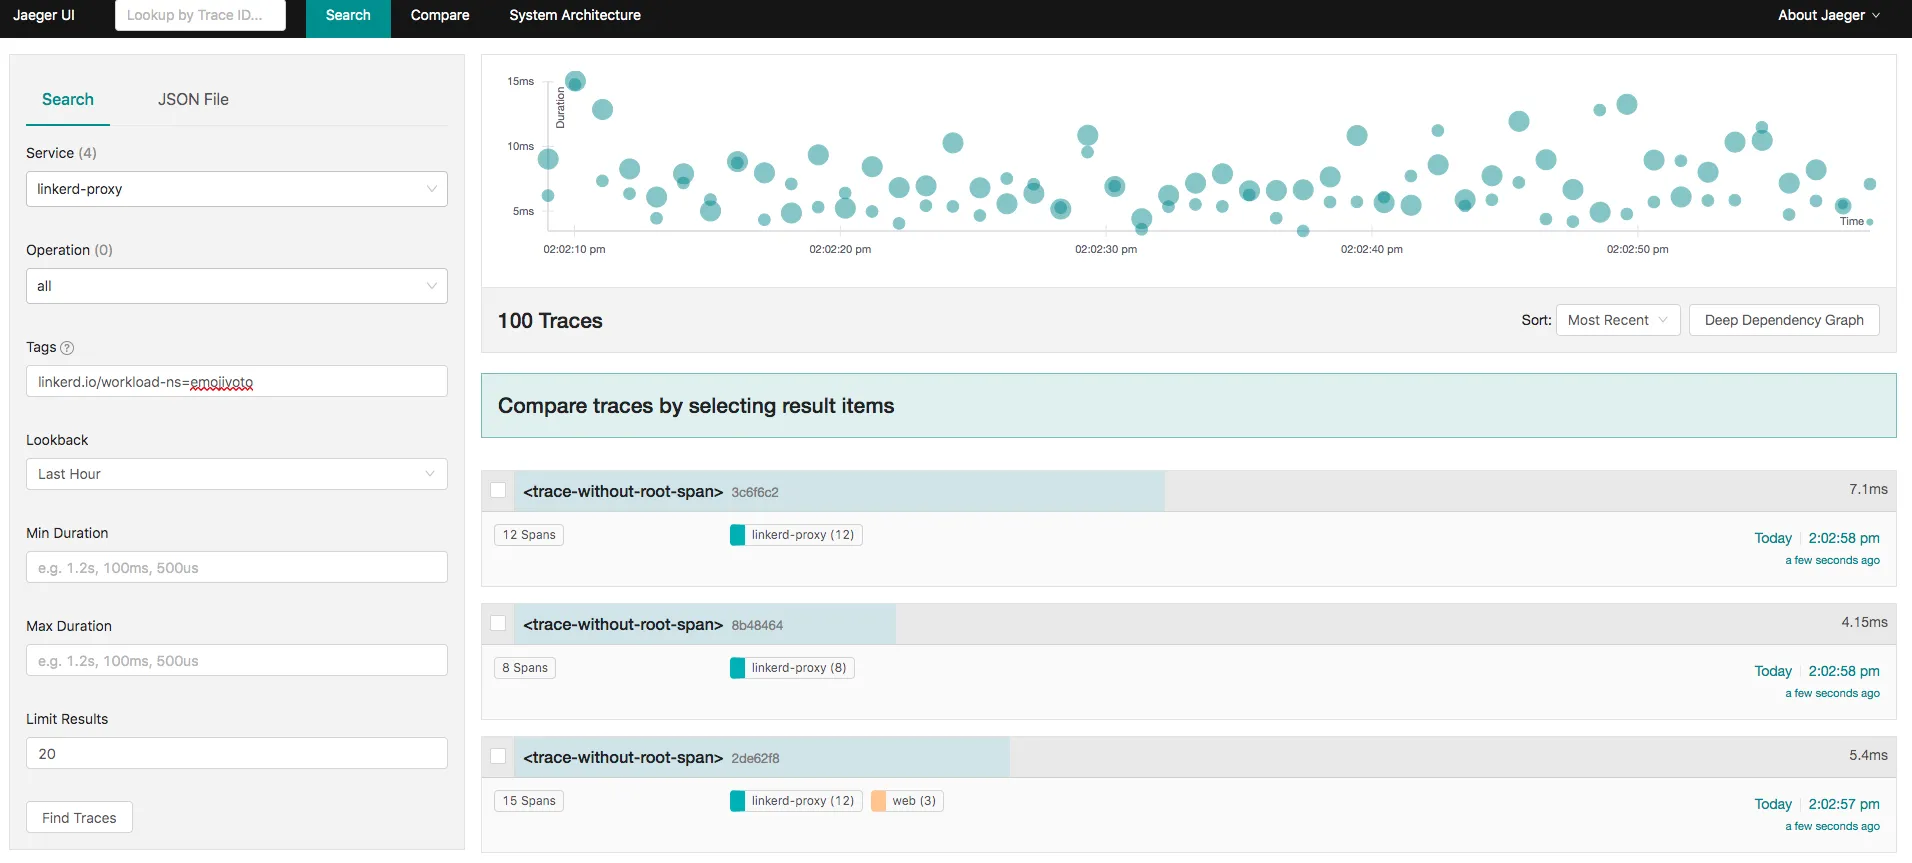
If we click on it, we’ll have all the calls made within the application and we can track the history of everything that was called via HTTP:
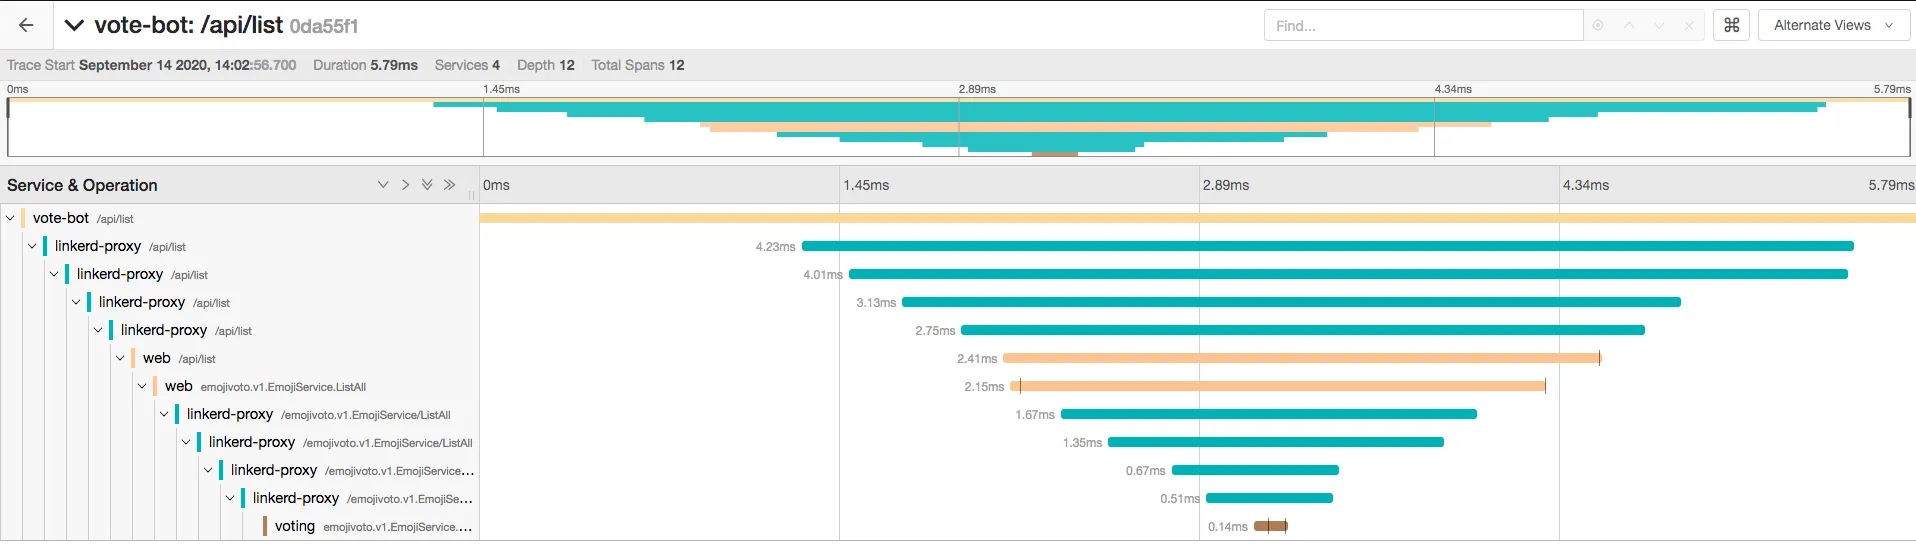
If we click on one of the lines, we can see where all the requests went and which services were called, as well as their payloads and timings:
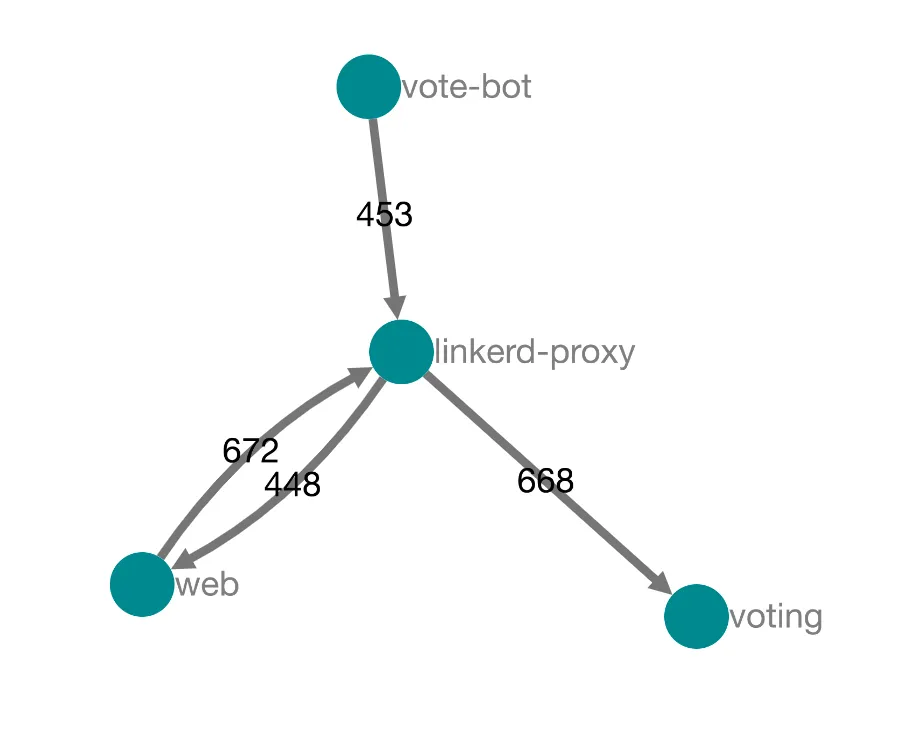
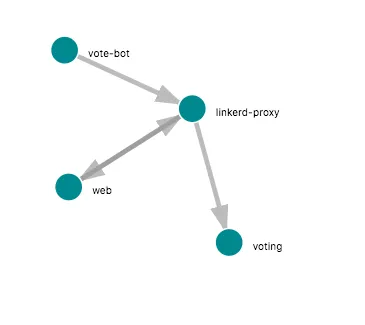
Another interesting feature is Jaeger’s ability to identify the possible architecture of the system. Just click on the “System Architecture” tab and choose between the directed graph and the DAG:
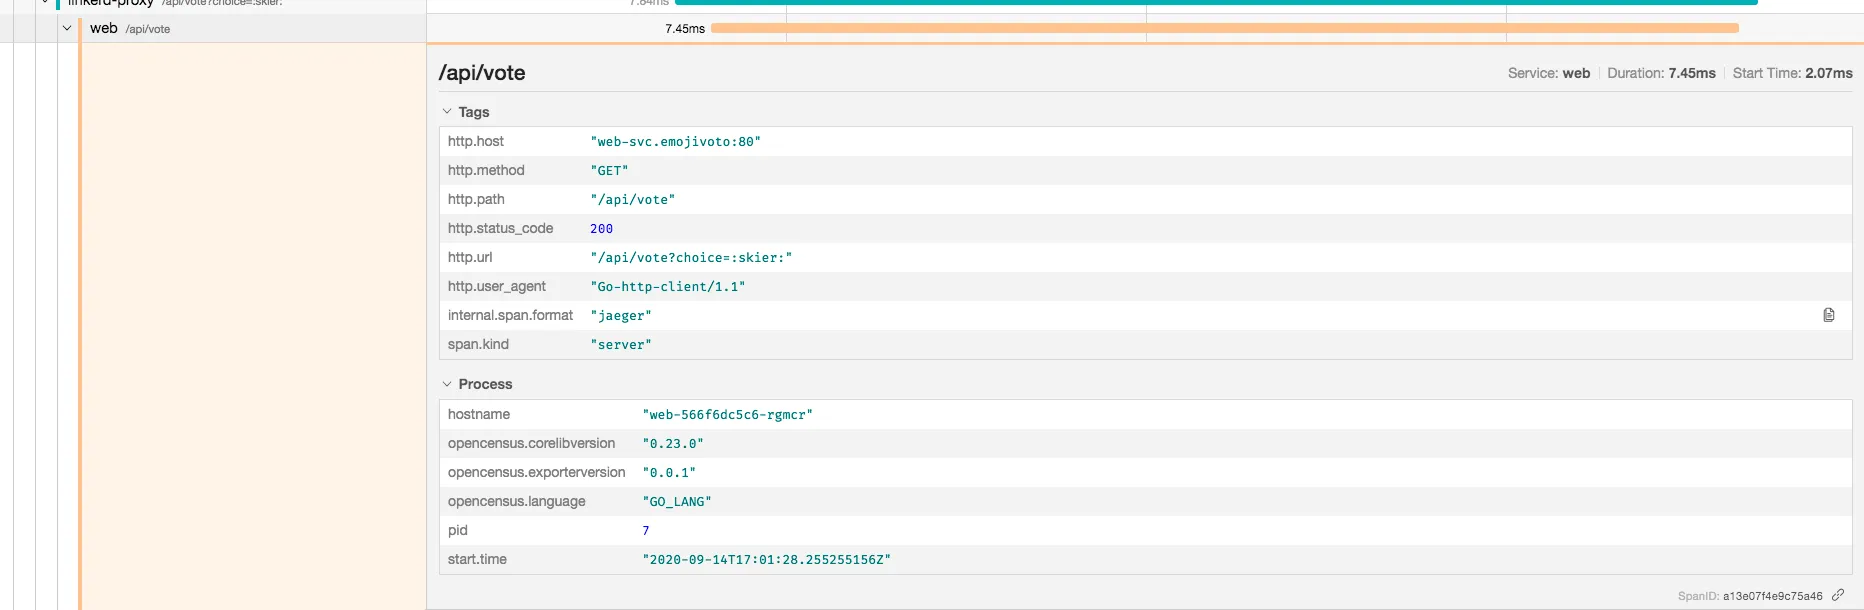
We can also explore each request individually through the same Jaeger icon on each line when we start the “Live View” of a route:
Conclusion#
We’ll talk more about observability here in the future, but keep in mind that tracing is one of the main reasons why service mesh is so sought after. The power you can extract when you know exactly what’s happening in your system allows you to solve bugs and handle errors much more simply and quickly.
I hope you enjoyed the article. Leave your comment, like, and share! Let’s help everyone understand what tracing is! Don’t forget to subscribe to the newsletter for more exclusive content!
See you soon!