An Introduction to Service Mesh with Linkerd
We recently discussed Service Mesh and how this architectural pattern can save your project by giving it more observability and ease of use.
We talked about Service Mesh in a very conceptual way. Now let’s get hands-on and create our own mesh using Linkerd!
Linkerd#

Linkerd is a project created inside Twitter in 2013, when the network was migrating its architecture from a layered platform to a microservices architecture. The Linkerd project was made open source in 2016 in what became known as version 0.1.
In 2017, the project was donated to CNCF (Cloud Native Computing Foundation), which is an arm of the Linux Foundation dedicated to managing open source projects. Some projects like Kubernetes, Helm, Brigade, Harbor, Envoy, and CoreDNS are part of this incredible foundation.
Recently, in 2018, Linkerd reached version 2.0. Linkerd v2 was released fixing a series of problems and based on lessons learned in v1. The original project intended to be highly configurable, powerful, and cross-platform. Version 2, on the other hand, aimed to be much simpler. The main design objectives for version two were:
- Zero configuration
- Simple and lightweight
- Designed for Kubernetes
By default, Linkerd already provides us with a series of native features:
- Protocol detection: Linkerd can, in addition to proxying TCP and gRPC protocols, automatically detect whether traffic is HTTP or gRPC.
- HTTP 1.1/2 and gRPC proxy: If any of these protocols is used, Linkerd can natively extract metrics, proxy, retry logic, and load balancing.
- Automatic injection and zero configuration: As we’ll see later, Linkerd is super simple to install, even in clusters with existing applications. This greatly facilitates tool adoption.
- Automatic mTLS by default: By default, all internal communication is encrypted using mTLS.
- Observability: In addition to logs and metrics, Linkerd can build a service graph based solely on incoming and outgoing traffic. All with metrics and data.
- Traffic splitting: A technique quite common for distributed applications is called Canary Deployment. This is when we deploy applications partially, by redirecting part of the traffic gradually to the new application while the old application is still running. Linkerd natively provides this functionality.
Architecture#
To better understand what we’re doing, let’s try to understand how Linkerd works and what architecture it follows. For this we have two concepts that are inherent to service mesh.
- Control Plane: Responsible for collecting and storing all information about requests and also controlling the flow of information.
- Data Plane: Where your application is located and where we have data transfers.
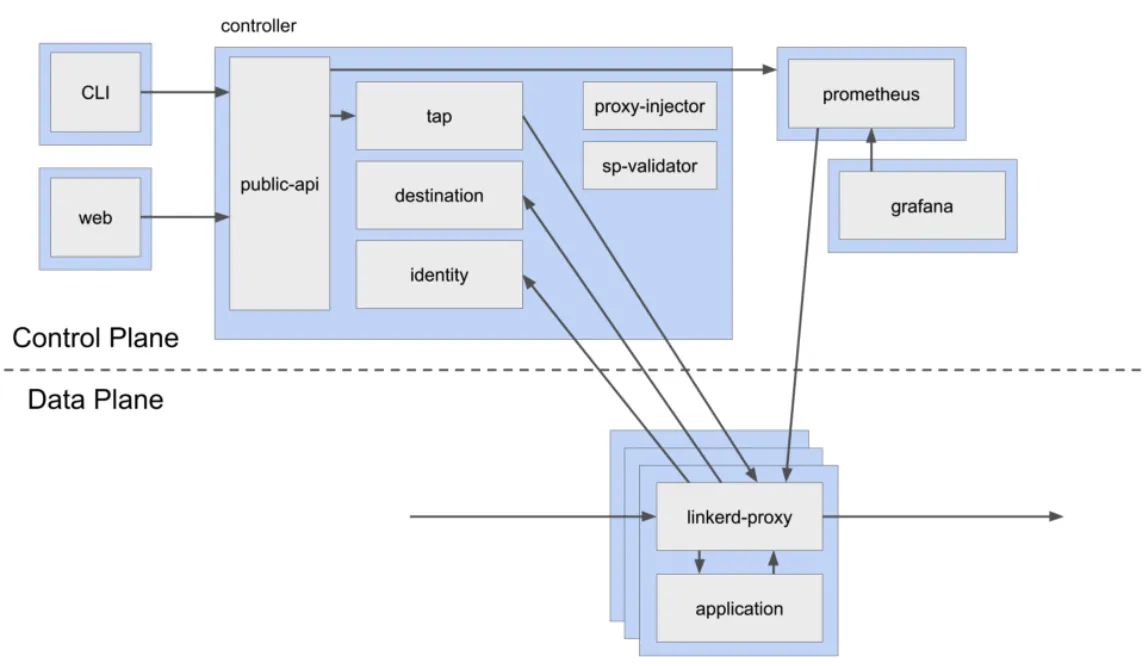
I won’t go through all the layers of the system completely, as that’s not the intent of the article, but I’ll talk a bit about each one so we can understand how all the parts communicate.
Proxy#
The only part that exists in the data plane. It’s responsible for capturing information and metrics from the containers where your applications are running.
This is done through the injection of two containers within your Kubernetes pods:
- Init Container: It will be executed before the pod’s container and will configure access rules, IP, and routes so that all communication first goes through the Linkerd proxy.
- Proxy Container: It’s the layer that will capture requests and extract metrics for analysis.
Controller#
It’s the part with the most responsibilities. It contains the core of Linkerd and has several functions:
- Hosts the API server
- Acts as a CA (Certificate Authority) for mTLS
- Service discovery information and load balancing for the proxy
- Enables tap, which is real-time inspection of network traffic on one or more routes/applications
- Automatically injects proxies into initiated containers
Web#
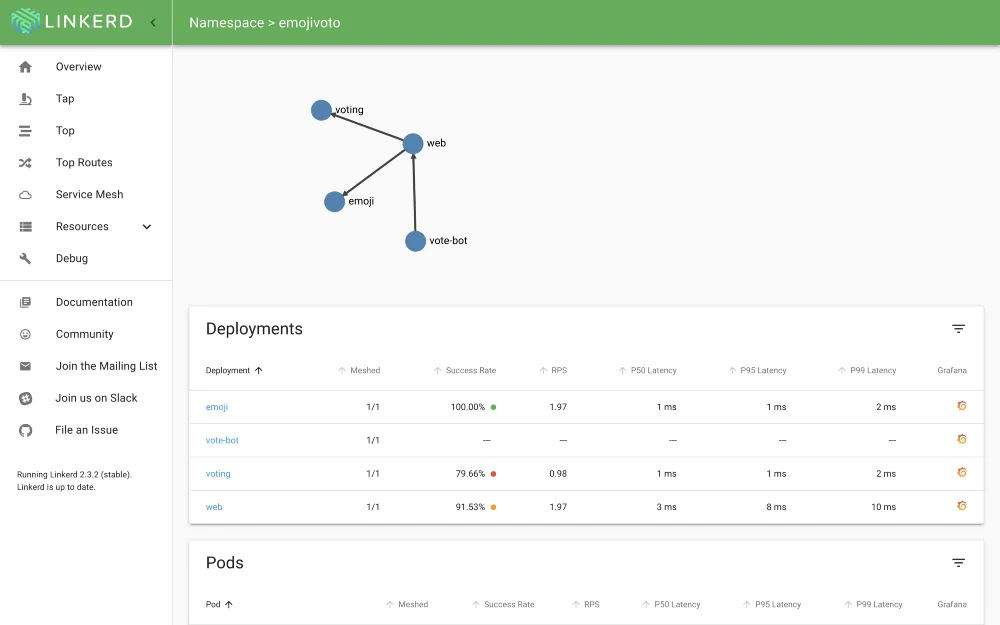
One of the great conveniences of Linkerd is the existence of a web interface that shows and controls all aspects of the mesh.
Prometheus#
Service for collecting metrics from the proxy. Fetches and temporarily stores metrics collected from your applications.
Often the Kubernetes cluster already comes with a Prometheus service, the Linkerd service is not configured for analysis, only for performance, so it does not store more than 6 hours of metrics.
Grafana#
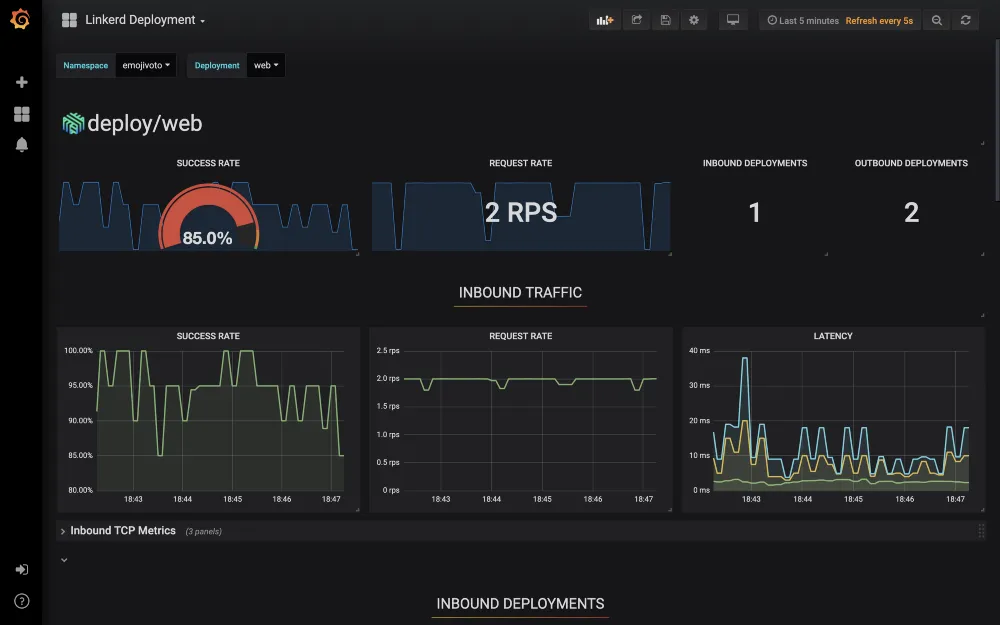
Fetches metrics and displays them as graphs and dashboards.
What about Istio?#
One of the main questions people ask when they look at Linkerd is:
What’s the difference between Linkerd and Istio?
Basically, we have some differences in the platform’s focus and also in architecture. However, in short, Linkerd is a tool more focused on performance than Istio.
Istio is more focused on providing more tools and functionality and, therefore, is more complex than Linkerd. In my opinion, using Linkerd is much easier for those starting with Service Mesh than Istio.
Creating a service mesh#
It’s time to move from theory to practice! Let’s get hands-on and understand how we can create a service mesh using Linkerd.
To do this hands-on I will create a cluster on AKS, but you can choose to do it on any Kubernetes cluster you have, even on a cluster already in production since Linkerd is non-destructive and installs its information in another namespace.
Within this cluster I will deploy the application present in the repository below
Azure-Samples/aks-bootcamp-sampleDemo repository for the AKS Bootcamp course. Contribute to Azure-Samples/aks-bootcamp-sample development by creating an account on GitHub.Azure-SamplesThis is a demonstration application that uses a front-end and a backend for communication. You can also follow using another application, for example, the Linkerd sample application.
I will assume that the cluster is already created and that the application is already running so we can jump straight to the part that matters.
Installation#
To run Linkerd, first we need to install the command line tool with the command:
curl -sL https://run.linkerd.io/install | shAnd add it to our path with the command:
export PATH=$PATH:$HOME/.linkerd2/binIf you use Mac, then you can install Linkerd with Homebrew via
brew install linkerd
Validation#
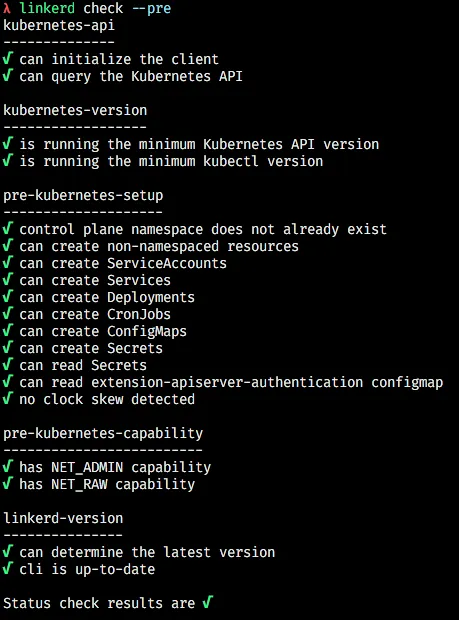
Before we install Linkerd on the cluster itself, let’s perform a validation by running the command:
linkerd check --preThis will ensure that all names and services are available for Linkerd to be installed.
Then we run the command:
linkerd install | kubectl apply -f -Notice that this command is actually a combination, because Linkerd doesn’t do any installation on the cluster, it only generates the output of a YAML file that can be used by the cluster to create its workloads, that’s why we pipe to kubectl apply -f -. Try running just linkerd install and see the files displayed on the screen.
Then, we’ll run the following command so we can check if the entire process was executed successfully:
linkerd checkIf all went well, you should have an output like this:
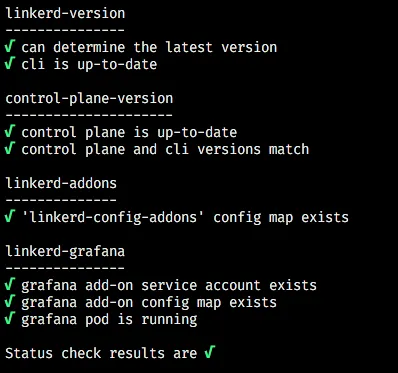
All Linkerd workloads are installed within their own namespace called linkerd, so you can search for all the resources we mentioned through kubectl with the command:
kubectl get all -n linkerdFirst impressions#
To start understanding how Linkerd works, you can type the command linkerd dashboard & and wait a few seconds for the web panel to open.
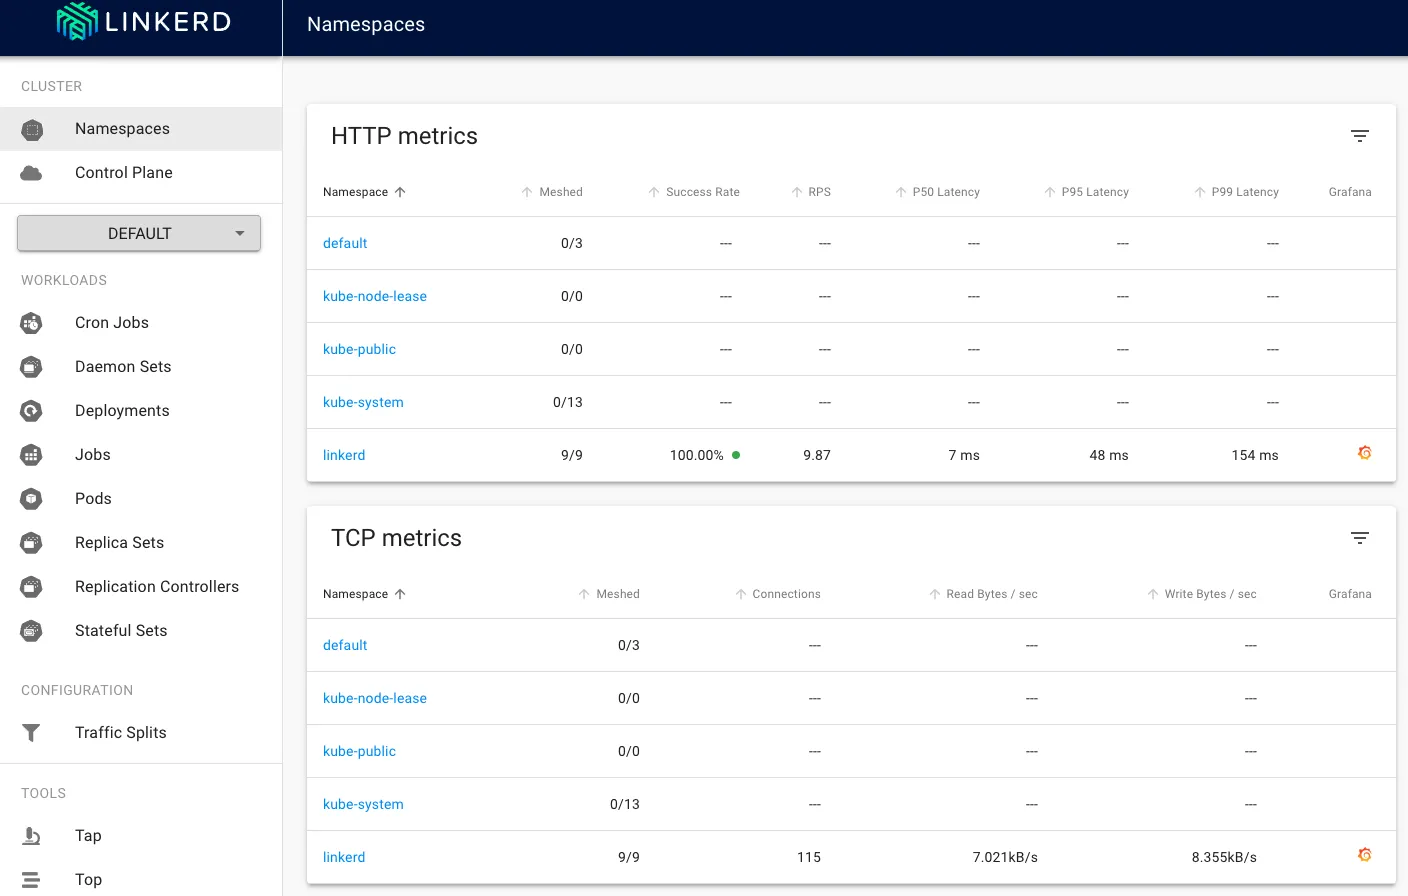
Through this panel you will be able to execute all Linkerd features as well as check the status of your cluster, it can also act as a dashboard for Kubernetes in a way. We just need to see the Workloads section in the left menu:
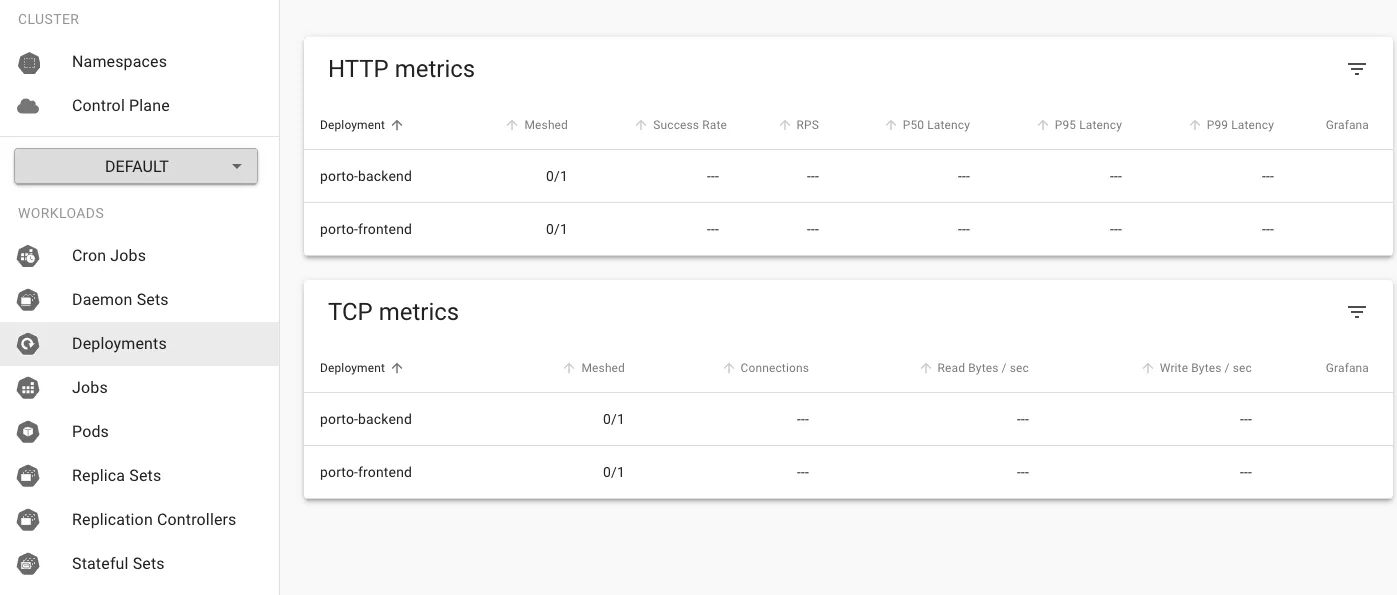
See that we’re working in the default namespace. This can be changed through the selection menu.
Control Plane#
If we click on the Control Plane section, we will have an overview of our entire Service Mesh.
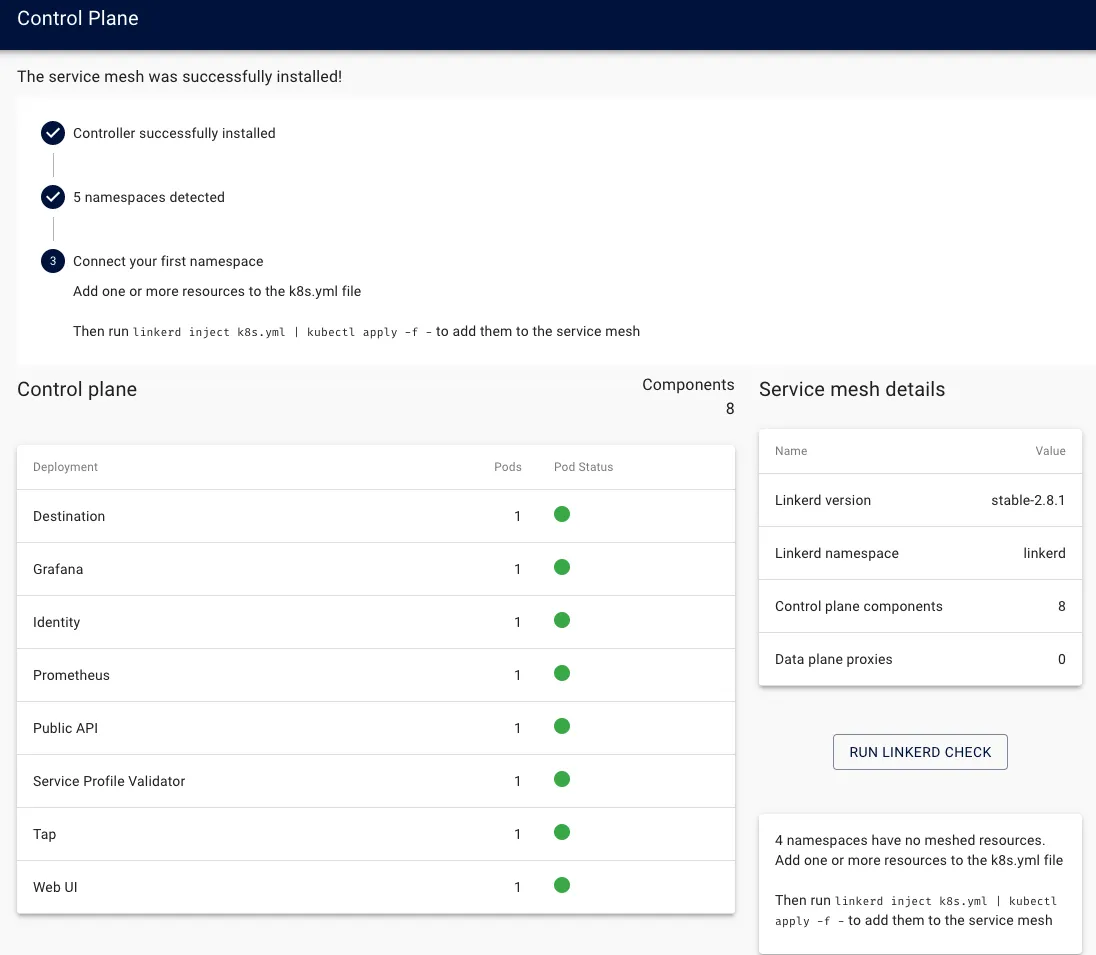
See that this panel shows us the entire system status and also the number of components we have installed.
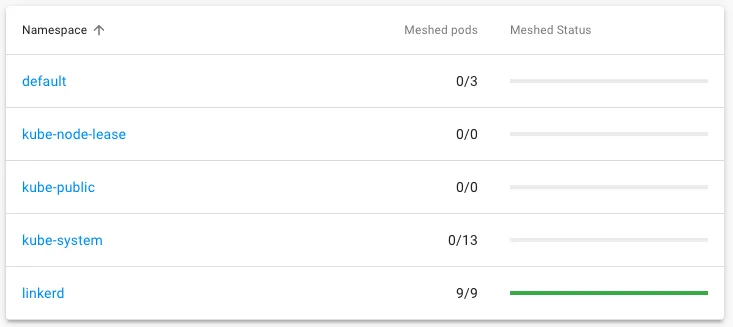
Further down, we can see the number of namespaces that are “meshed,” meaning they are injected by the Linkerd proxy so they are generating metrics:
Adding metrics#
Our application is in the default namespace, how do we include it in the Service Mesh? Simple! Let’s execute the following command:
kubectl get deploy -o yamlSee that we have all the YAML files of our deployments, so let’s create a pipe from this command to the linkerd inject command:
kubectl get deploy -o yaml | linkerd inject -Now see the difference between the two files. The injected file will have an annotation in the pod template like this:
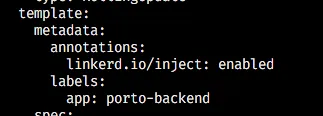
This is the only change made to your deployments, meaning it’s very easy to inject Linkerd into services that are already in production without causing many side effects.
Let’s apply the changes through another pipe to the apply command:
kubectl get deploy -o yaml | linkerd inject - | kubectl apply -f -As soon as we apply the change we can see a movement in the Control Plane so it will be reloading our pods again to include them in the metrics:

See that we don’t have one of the pods sending metrics… The MongoDB pod is out of the mesh, but why?
Because in this example, it’s a StatefulSet not a deployment! So let’s execute the same command we executed earlier, but we’ll replace deploy with sts.
kubectl get sts -o yaml | linkerd inject - | kubectl apply -f -Important: For this example I’m using a simple version of MongoDB within the local cluster, you can use a version hosted by any provider, such as Mongo Atlas, for example, or other solutions. The application only needs a MongoDB to function.
Now we have all the details:

Tools#
Linkerd gives us a series of interesting tools, let’s explore some of them.
Grafana#
Click on the namespace name in the Control Plane tab.
In addition to being able to verify the metrics within the Linkerd panel, we can also find a Grafana dashboard by clicking on the small orange icon in the right corner.
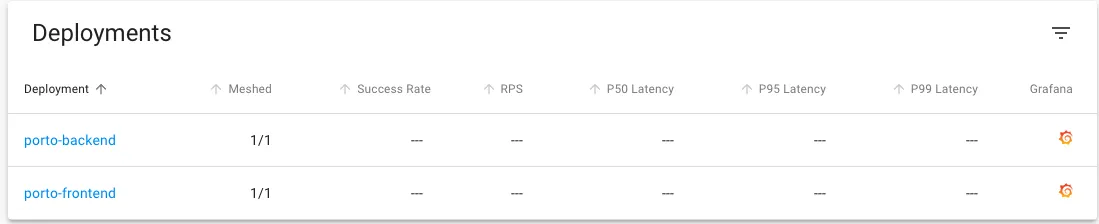
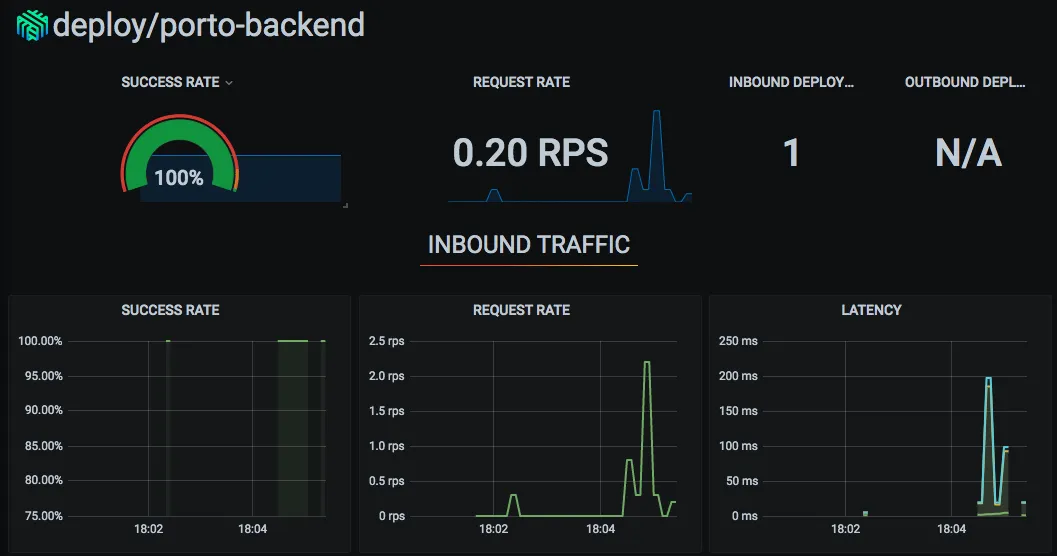
Let’s open the panel for the porto-backend deployment:
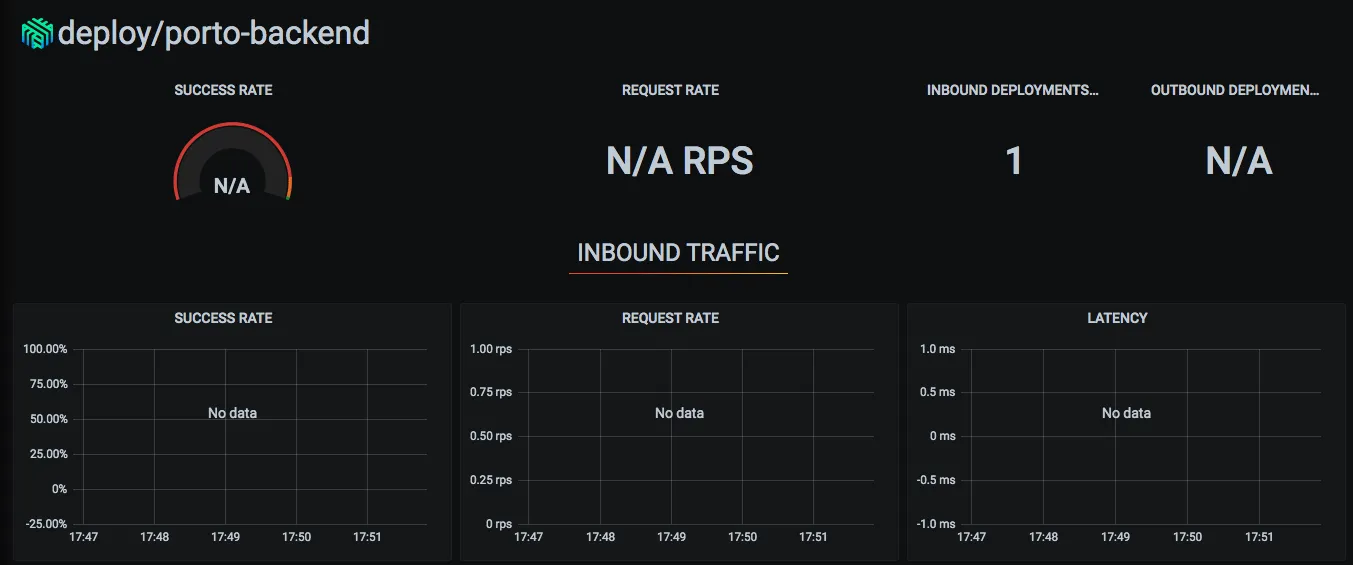
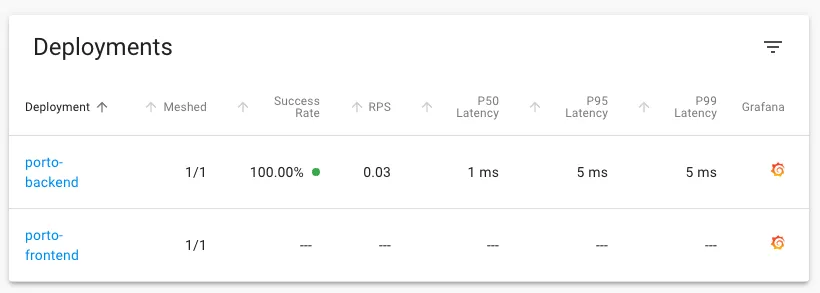
See that the dashboard doesn’t show any data… Why? Because we haven’t made any requests that can be captured yet! Let’s go into our application and create some access. To find the URL of your application use the kubectl get ing command to search for the ingresses and thus the URLs.

As soon as we start making some access we can see some data arriving:
And we can see what’s happening in the grafana charts too!
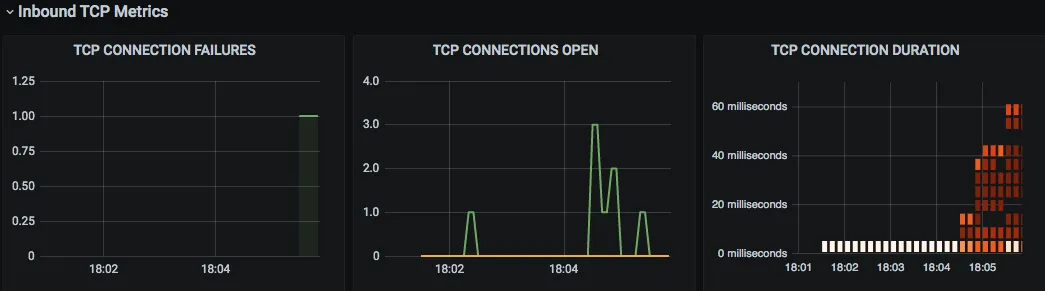
We also have TCP traffic metrics:
In addition to this dashboard, we have other internal dashboards that Linkerd itself created.
Real-time view#
By clicking on our deployment within the namespace view, we can see in real-time the calls being made.
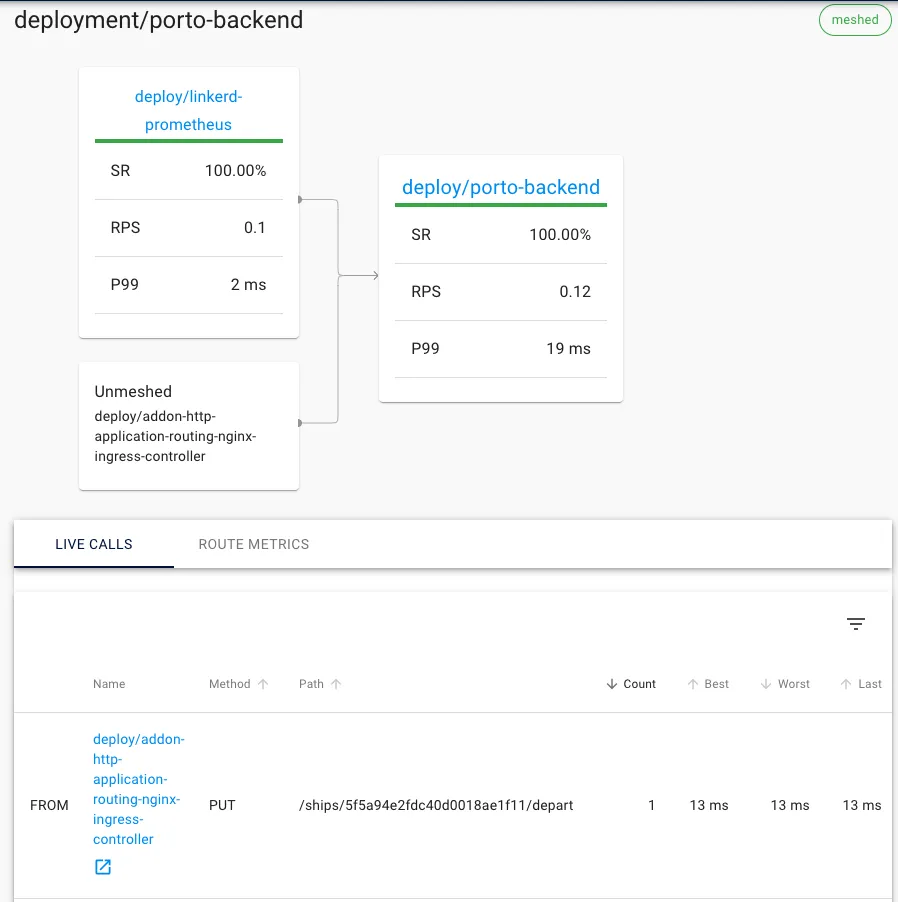
We can also see a map of the application that shows us which services are connected.
Top#
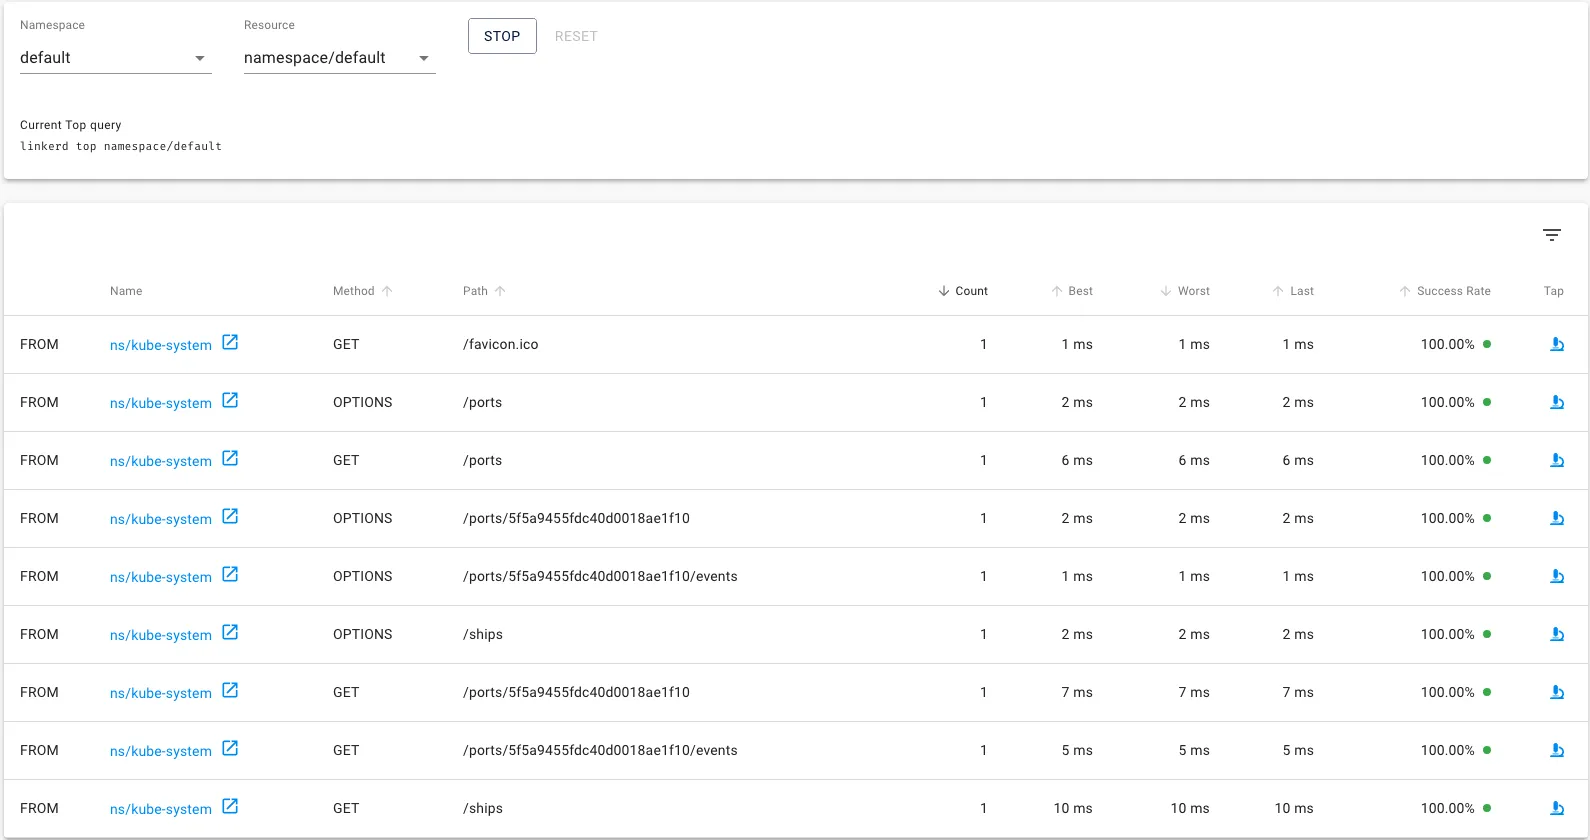
If we click on the Top menu in the Tools section of the left menu. We’ll be able to select a namespace or resource so we can monitor in real-time. Select the default namespace and make some requests to the application. See that we start to have metrics tracking:
Tap#
Still in the same view, see that we have the icon of a microscope, this icon allows us to observe that specific route for more details.
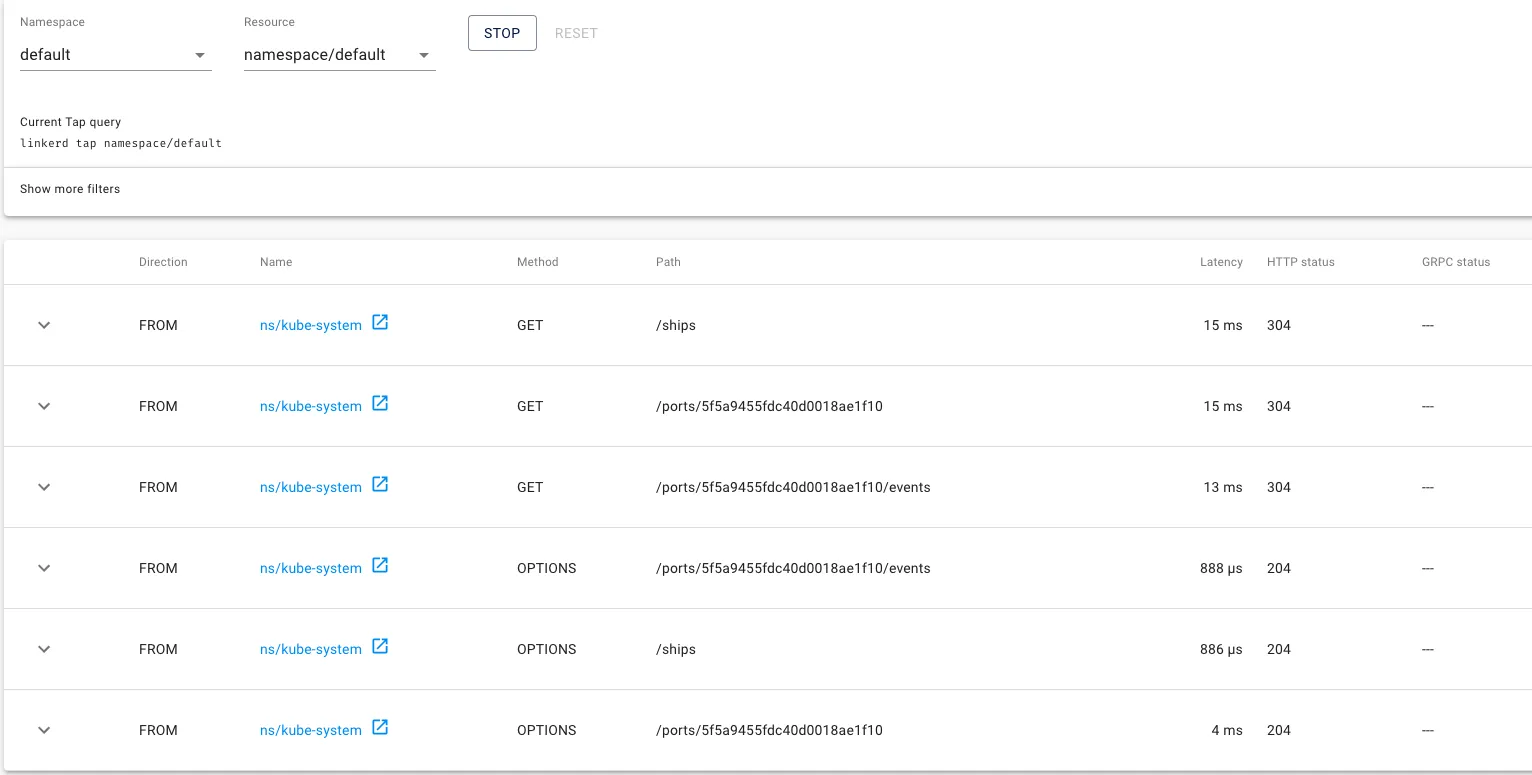
Let’s open the Tap tab in the left menu. Select the default namespace at the top and click start. As soon as we make some requests, we can see all of them in real-time.
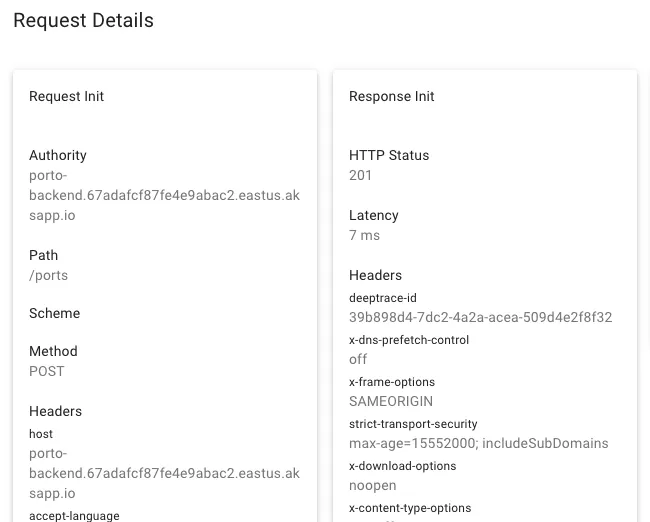
By clicking on the left arrow, we’ll have a detailed view of the request.
Service graph#
In my opinion, one of the coolest features of Linkerd is the service graph. To better represent how it works, let’s go back to the namespaces view in the left menu and click on the linkerd namespace.
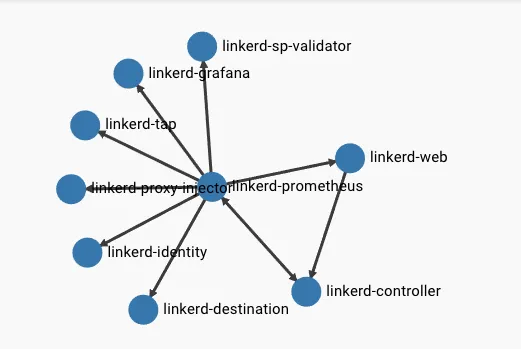
At the top of the screen we’ll have a representation of the services that are talking to each other and which ones are sending requests. This is very useful when we’re talking about very large meshes.
Removing Linkerd#
To remove linkerd from a namespace just run the command
kubectl get deploy -o yaml | linkerd uninject - | kubectl apply -f -That is, the same way we run inject, we also run uninject.
Conclusion#
Linkerd can greatly ease the life of those developing distributed applications, because it’s simple and easy to install, it has a great advantage over other Service Mesh systems and can prove to be an excellent addition to your infrastructure.
Don’t forget to subscribe to the newsletter to receive this content and also weekly news! Like and share your feedback in the comments!
See you later!
Footnotes#
-
You can also use solutions to run K8S locally with minikube, Docker, or other options ↩