Custom metrics with AKS
When working with microservices, we always hear that monitoring and observability are key metrics to keep our ecosystem cohesive, functional, and maintain sanity about what’s happening. We talked about this in the #FalaDev podcast I participated in with several guests.
After all, in distributed systems, the complexity is not in the unit itself, but in how these units interact with each other. And if we don’t know what’s happening in our ecosystem, we can’t diagnose, understand, and much less respond to incidents in a timely manner.
But how can we solve these problems? The answer is quite simple: we need to start monitoring our applications.
Azure Monitor For Containers#
For this type of situation, we have tools like Azure Monitor. This is a tool provided by Azure for monitoring several of its products, one of which is AKS.
The idea of this article is to understand a bit more about Azure Monitor first, then we’ll create a small application that will extract some custom metrics from some of our services. So let’s start by understanding how it works!
How does Azure Monitor For Containers work?#
As this great article by Thomas Stringer says, Azure Monitor is a solution that includes several facets, one of which is data visualization obtained through metrics capture by what we call an agent.
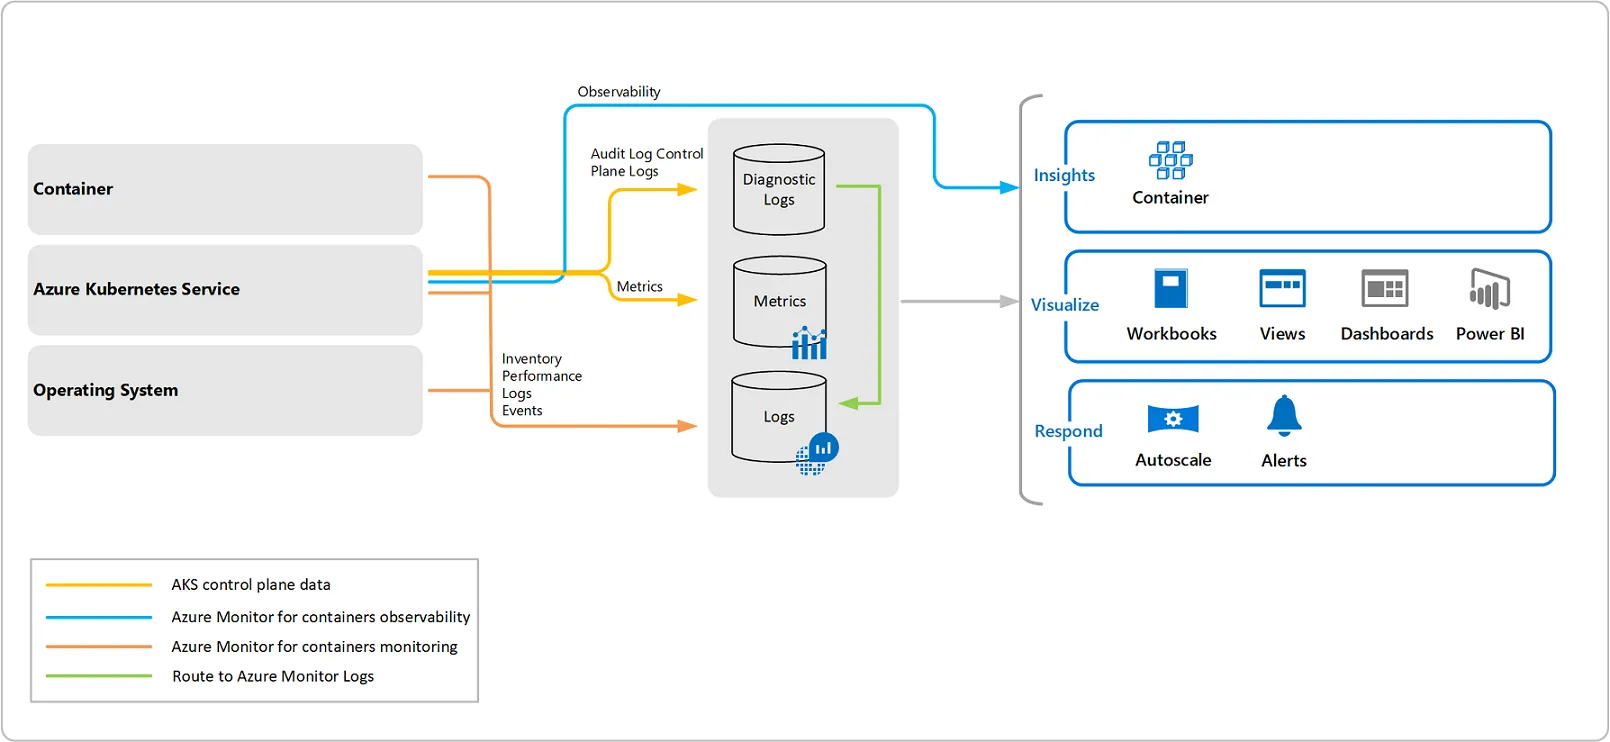
An agent is a small service that runs inside our cluster as a daemonset, that is, a service that creates a pod in each node of our cluster to be able to capture machine resource metrics, such as CPU, RAM, etc.
By default, this feature comes disabled when we create a new AKS cluster, so we need to enable it. We’ll learn how to do that in the next chapter.
Once the feature is enabled, a DaemonSet called omsagent is installed in the cluster and a deployment called omsagent-rs is created in each node of the cluster. This deployment is responsible for aggregating metrics and sending them to what we call a Log Analytics workspace, that is, the place where all our metrics will be stored for us to read.
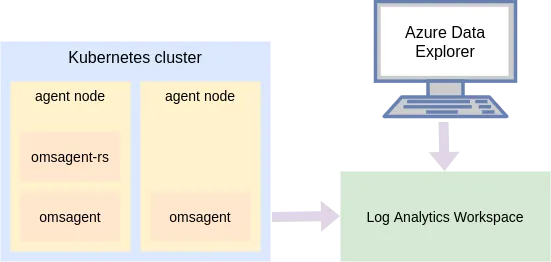
Once we have all the services running, we’ll be able to get the metrics of our cluster by accessing either Azure’s own dashboard or a tool called Azure Data Explorer.
Monitoring a cluster#
First, we need to create an AKS cluster to monitor. For that, we need to register two extensions in our Azure CLI (if you don’t have Azure CLI installed yet, then install it on your machine).
Let’s check if we already have the providers installed with the following commands:
az provider show -n Microsoft.OperationsManagement -o table && \az provider show -n Microsoft.OperationalInsights -o tableIf we have outputs of this type:
Namespace RegistrationPolicy RegistrationState------------------------------ -------------------- -------------------Microsoft.OperationsManagement RegistrationRequired Registered
Namespace RegistrationPolicy RegistrationState----------------------------- -------------------- -------------------Microsoft.OperationalInsights RegistrationRequired RegisteredThis means the providers are installed and working (see the Registered). However, if we need to install them, we’ll have to run the following commands:
az provider register --namespace Microsoft.OperationsManagement && \az provider register --namespace Microsoft.OperationalInsightsThe process may take a few minutes to complete. Run the first command again to make sure the provider was registered. Now let’s create a new Resource Group and store both its value and the name of our new cluster in a variable:
export RESOURCE_GROUP=aksmonitorexport CLUSTER_NAME=aksmonitoraz group create -n $RESOURCE_GROUP -l eastusThen we can create a new AKS cluster enabled for monitoring through the command:
az aks create \ -g $RESOURCE_GROUP \ -n $CLUSTER_NAME \ --node-count 1 \ --generate-ssh-keys \ --enable-addons monitoring,http_application_routingIf you already have an AKS cluster created, you can enable monitoring through the command
az aks enable-addons -a monitoring -n $CLUSTER_NAME -g $RESOURCE_GROUP
Creating a test#
Let’s create some test pods so we can monitor system usage. First, we’ll create a simple deployment that will expose a small Node.js API. For that, we’ll create a new file simple_api.yaml and add our instructions:
apiVersion: apps/v1kind: Deploymentmetadata: name: simple-apispec: selector: matchLabels: app: simple-api template: metadata: labels: app: simple-api spec: containers: - name: simple-api image: khaosdoctor/scalable-node-api:2.0.0 resources: limits: memory: "128Mi" cpu: "100m" ports: - containerPort: 8080 name: http env: - name: PORT value: "8080"---apiVersion: v1kind: Servicemetadata: name: simple-apispec: type: LoadBalancer selector: app: simple-api ports: - port: 80 targetPort: httpThis service will give us an external IP address that can be obtained using kubectl get svc in the EXTERNAL-IP column:
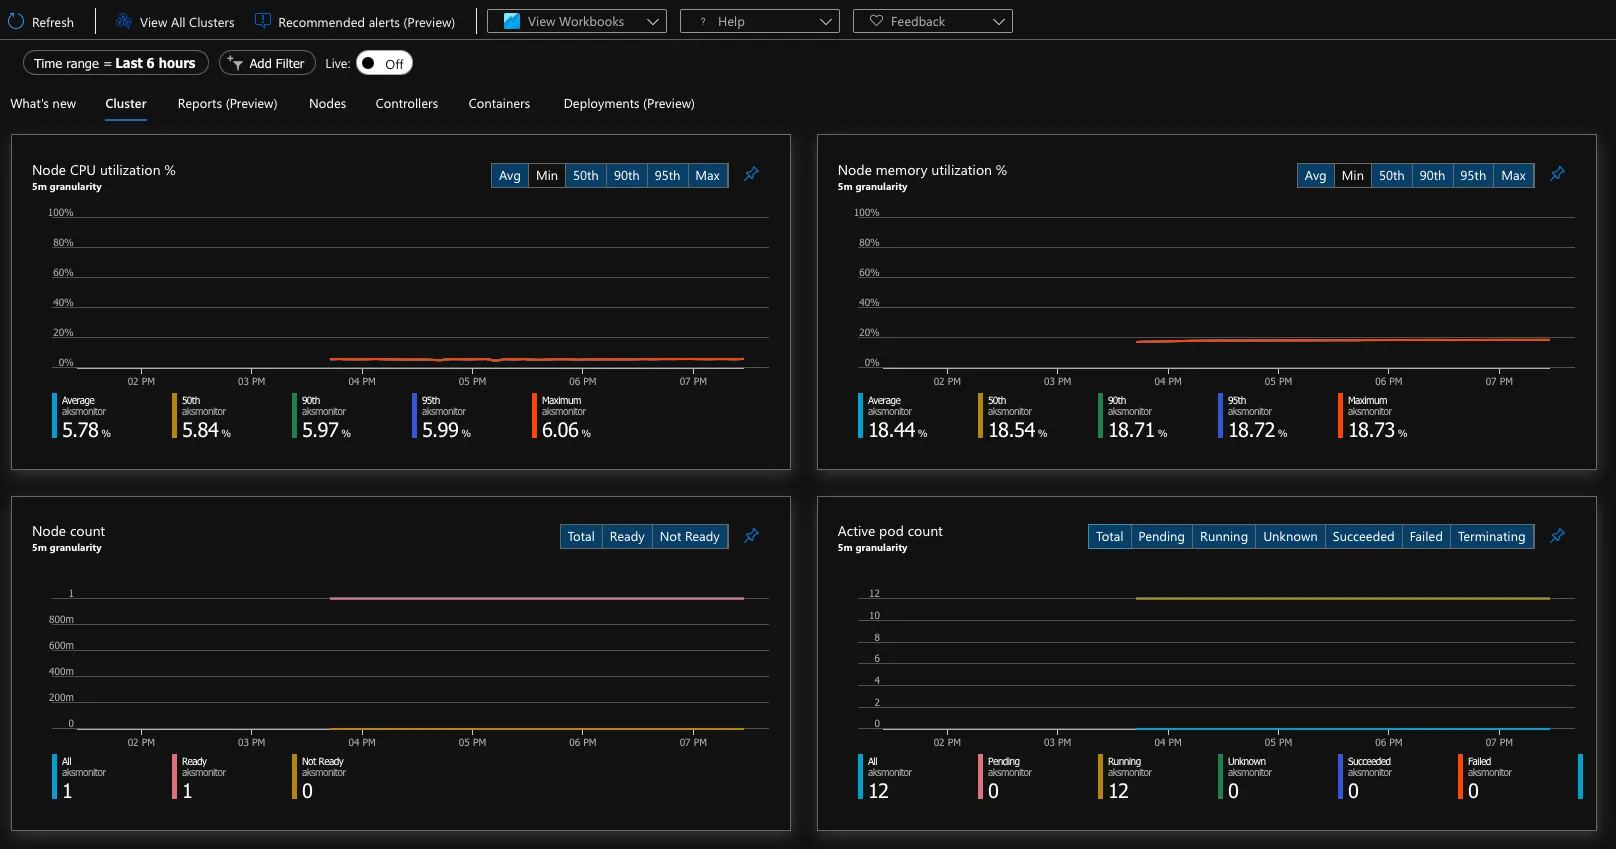
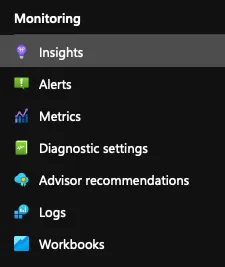
NAME TYPE CLUSTER-IP EXTERNAL-IP PORT(S)simple-api LoadBalancer 10.0.50.182 xxx.xxx.xxx.xxx 80:30287/TCPAccess the address after a few moments to see the pod running. In this version we’ll have a 2-second delay generating a small load so we can see resource consumption. Let’s go to our Azure portal and select our AKS cluster, then go to the “Insights” menu:
Let’s use kubectl’s scale command to be able to scale the pods and see that we have constant monitoring:
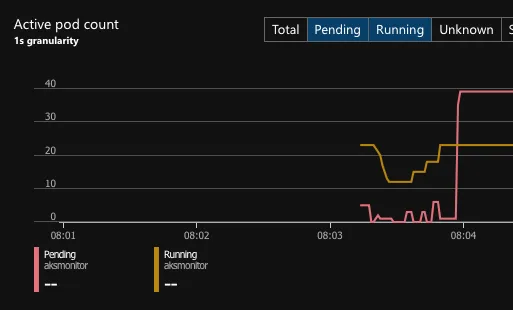
If we run a stress test, we’ll see a gradual increase in memory and CPU usage:

Additionally, we have several workbooks which are pre-made dashboards that allow us to view some data:
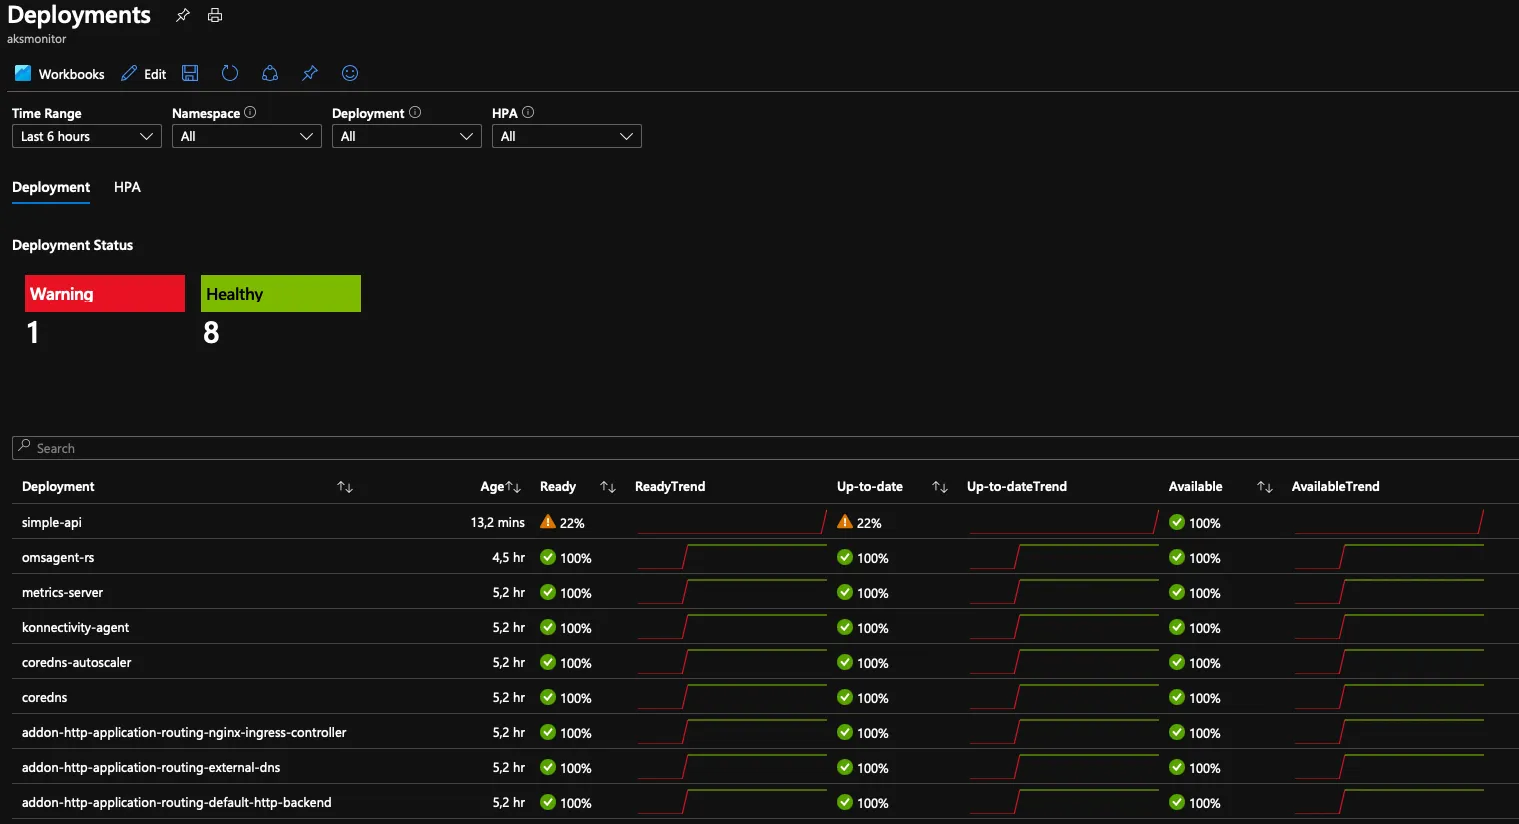
We can also get the logs of our containers through the logs menu on the left side of the panel:
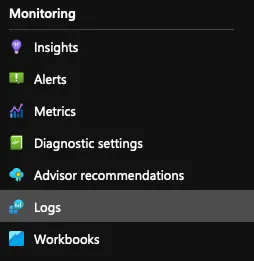
Here we’ll have an initial view with a modal asking if we want to see some ready-made queries. Let’s go to the “Audit” tab and then click “Run” below “List containers logs per namespace”:

See an example of a query in Kusto format:
// List container logs per namespace// View container logs from all the namespaces in the cluster.ContainerLog| join(KubePodInventory | where TimeGenerated > startofday(ago(1h)))//KubePodInventory Contains namespace information on ContainerID| where TimeGenerated > startofday(ago(1h))| project TimeGenerated, Namespace, LogEntrySource, LogEntryWe’ll have a list of all the logs generated by our application:
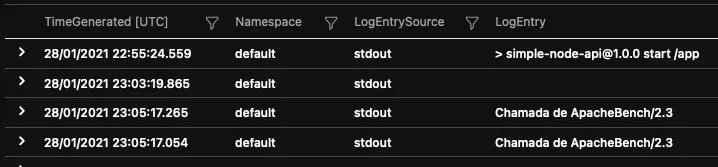
But what if we want to generate more information and search for more data? How do we create a custom metric in Azure Monitor?
Creating custom metrics#
To understand a bit about what we’ll do next, we need to understand how Kubernetes works with metrics.
Prometheus#
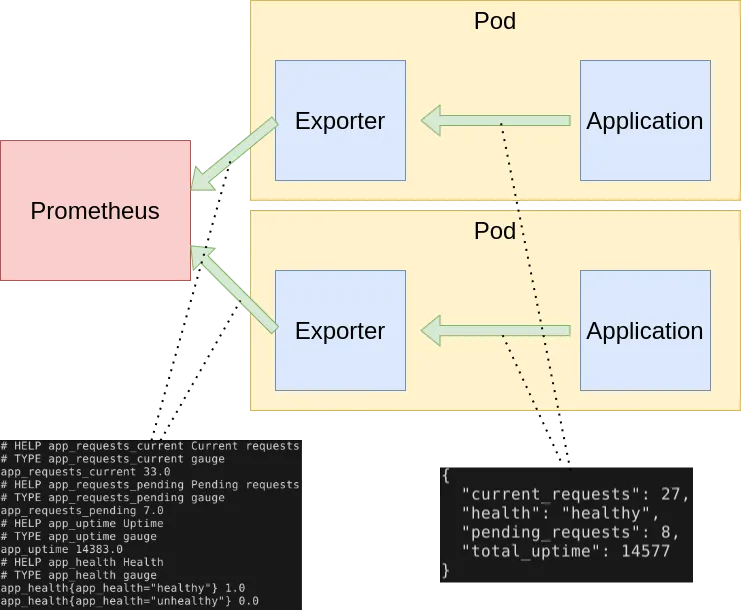
Currently, Prometheus is the market leader when it comes to storage and collection of metrics for distributed applications. Prometheus works in a scraping model, that is, from time to time it accesses a URL defined in its registered endpoints and retrieves the data in a specific format. The abstraction layer that runs between a service and Prometheus is called an exporter.
Exporters fetch metrics from APIs and applications and format them so they can be consumed by Prometheus correctly. For this reason, they are usually run inside the same pod, in another container, accessing the application locally. As this image from Thomas Stringer’s blog shows us:
Exporters#
When we’re working with a technology that doesn’t yet have a ready-made exporter, or when we want to scrape metrics from applications we wrote ourselves (which is our case here), we can write our own through a list of available clients.
The work of an exporter is basically to run a loop where it:
- Starts an HTTP server
- Fetches metrics from the target application
- Processes the metrics and formats them
- Returns the metrics to Prometheus when needed
- Sleeps for a certain time before starting again
The application we’ll be using is a simple voting application written in Go. You can see the source code in this repository. We have an image hosted in my personal Docker Hub.
Since I created the application from scratch, I built a small exporter in Node.js for it that you can check in this repository with this image. Basically, the application only has a single index.js file that starts a Koa server using a Prometheus client library.
const Koa = require('koa')const app = new Koa()const axios = require('axios').default
const prometheus = require('prom-client')const PrometheusRegistry = prometheus.Registryconst registry = new PrometheusRegistry()
const PREFIX = `go_vote_api_`const pollingInterval = process.env.POLLING_INTERVAL_MS || 5000registry.setDefaultLabels({ service: 'go_vote_api', hostname: process.env.POD_NAME || process.env.HOSTNAME || 'unknown' })
// METRICS START
const totalScrapesCounter = new prometheus.Counter({ name: `${PREFIX}total_scrapes`, help: 'Number of times the service has been scraped for metrics'})registry.registerMetric(totalScrapesCounter)
const scrapeResponseTime = new prometheus.Summary({ name: `${PREFIX}scrape_response_time`, help: 'Response time of the scraped service in ms'})registry.registerMetric(scrapeResponseTime)
const localResponseTime = new prometheus.Summary({ name: `${PREFIX}exporter_response_time`, help: 'Response time of the exporter in ms'})registry.registerMetric(localResponseTime)
const totalVotes = new prometheus.Gauge({ name: `${PREFIX}total_votes`, help: 'Total number of votes computed until now', async collect () { const total = await scrapeApplication() this.set(total) }})registry.registerMetric(totalVotes)
// --Utility Function-- //
async function scrapeApplication () { const id = Date.now().toString(16) console.log(`Scraping ${process.env.SCRAPE_URL}:${process.env.SCRAPE_PORT}/${process.env.SCRAPE_PATH} [scrape id: ${id}]`) const start = Date.now() const metrics = await axios.get(`${process.env.SCRAPE_URL}:${process.env.SCRAPE_PORT}/${process.env.SCRAPE_PATH}`) scrapeResponseTime.observe(Date.now() - start) totalScrapesCounter.inc() console.log(`Scraped data [scrape id: ${id}]`) return metrics.data.total}
// --Servers start-- //
app.use(async (ctx, next) => { console.log(`Received scrape request: ${ctx.method} ${ctx.url} @ ${new Date().toUTCString()}`) const start = Date.now() await next() localResponseTime.observe(Date.now() - start)})
app.use(async ctx => { ctx.set('Content-Type', registry.contentType) ctx.body = await registry.metrics()})
// start loopif (pollingInterval > 0) { setInterval(async () => { const total = await scrapeApplication() totalVotes.set(total) }, pollingInterval)}
console.log(`Listening on ${process.env.SCRAPER_PORT || 9837}`)app.listen(process.env.SCRAPER_PORT || 9837)What this application is doing is registering a series of metrics in a standard Prometheus registry. The metrics we’re capturing are:
- Total number of votes
- Number of times we fetch the metrics
- Response time of the exporter and also the API on the
/totalroute
Obviously, these metrics are not as important as other metrics that can be obtained through direct instrumentation in the application. For this reason, a good practice is to have a
/metricsroute that serves the application’s instrumentation metrics, such as CPU, RAM, and others, in addition to the exporter.
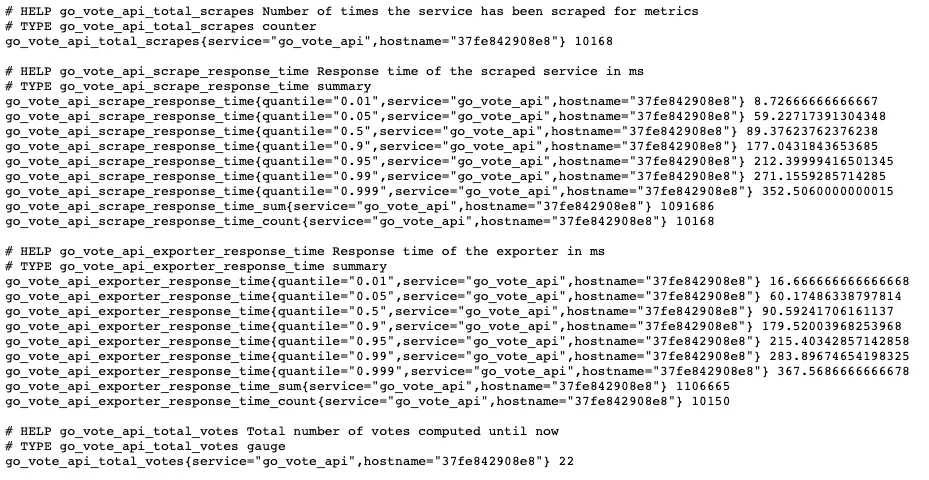
If we access the exporter, we’ll have an output like this:
Extracting metrics from the application#
To extract metrics from the application, we’ll run the two containers side by side. This way, we don’t burden the original application with searching for and parsing metrics, and we maintain connection speed since they’re on the same network. Our previous deployment file will change a bit:
apiVersion: apps/v1kind: Deploymentmetadata: name: vote-apispec: selector: matchLabels: app: vote-api template: metadata: labels: app: vote-api spec: containers: - name: vote-api image: khaosdoctor/go-vote-api resources: limits: memory: "128Mi" cpu: "200m" ports: - containerPort: 8080 name: http - name: vote-api-exporter image: khaosdoctor/go-vote-api-exporter resources: limits: memory: "128Mi" cpu: "100m" ports: - containerPort: 9837 name: exporter env: - name: SCRAPE_PORT value: "8080" - name: SCRAPE_PATH value: total - name: SCRAPE_URL value: "http://localhost" - name: vote-api-voter image: curlimages/curl command: ["/bin/sh"] args: [ "-c", "while true; do wget -O- http://localhost:8080/votes/Lucas; sleep 3; done" ] resources: limits: memory: "128Mi" cpu: "100m"---apiVersion: v1kind: Servicemetadata: name: vote-apispec: type: LoadBalancer selector: app: vote-api ports: - port: 80 targetPort: http---apiVersion: v1kind: Servicemetadata: name: vote-api-exporterspec: selector: app: vote-api ports: - port: 9837 targetPort: exporterWhat we’re doing is running three containers alongside the application. One of them is the exporter and the other is a simple application that will be voting every 3 seconds to simulate vote increases. Note that we’re setting localhost as the scraping URL because all containers are on the same local network.
We can check the logs of each created container later with the command kubectl logs deploy/vote-api -c <container-name>. To see our exporter in action, just run kubectl port-forward svc/vote-api-exporter 9837:9837 and access localhost:9837 on our machine:
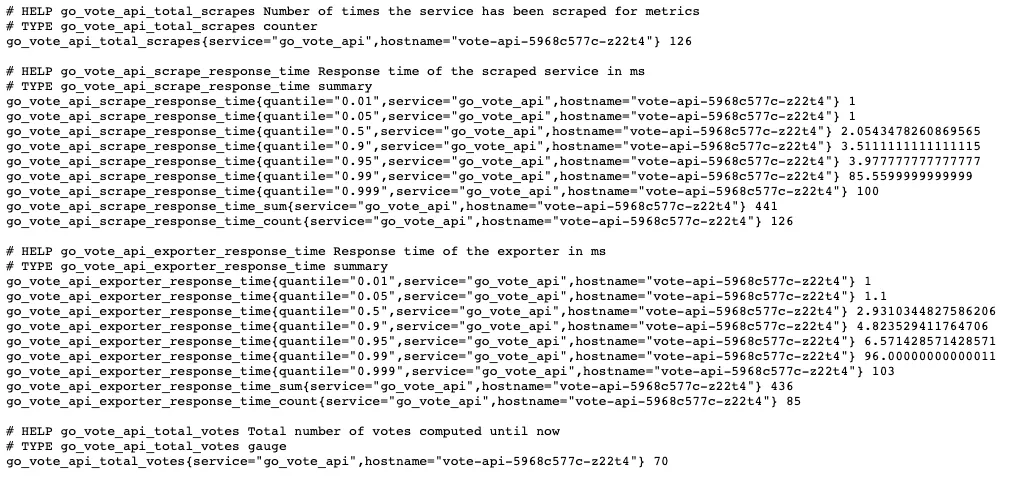
Note that now we have more labels, such as the hostname that wasn’t being fetched before.
Preparing Azure Monitor#
Now that we have our API ready, let’s prepare Azure Monitor to be able to fetch metrics. For this, we’ll create a simple ConfigMap that will configure our agent within the Node. Microsoft itself has a standard configuration template that we can download with the command below:
$ curl -Lo agent-config.yaml https://aka.ms/container-azm-ms-agentconfigSave the file and see that it’s well commented. It’s a long file, but the part we’re interested in is here:
# When monitor_kubernetes_pods = true, replicaset will scrape Kubernetes pods for the following prometheus annotations: # - prometheus.io/scrape: Enable scraping for this pod # - prometheus.io/scheme: If the metrics endpoint is secured then you will need to # set this to `https` & most likely set the tls config. # - prometheus.io/path: If the metrics path is not /metrics, define it with this annotation. # - prometheus.io/port: If port is not 9102 use this annotation monitor_kubernetes_pods = falseLet’s change monitor_kubernetes_pods to true. This will cause any deployments with the prometheus.io/scrape and prometheus.io/scheme annotations to be scraped by the agent as if Prometheus were scraping metrics. Now let’s create the configuration with kubectl apply -f agent.yaml.
Now let’s add the annotations to our deployment file:
apiVersion: apps/v1kind: Deploymentmetadata: name: vote-apispec: selector: matchLabels: app: vote-api template: metadata: labels: app: vote-api annotations: prometheus.io/scrape: "true" prometheus.io/path: / prometheus.io/port: "9837" spec: containers: - name: vote-api image: khaosdoctor/go-vote-api resources: limits: memory: "128Mi" cpu: "200m" ports: - containerPort: 8080 name: http - name: vote-api-exporter image: khaosdoctor/go-vote-api-exporter resources: limits: memory: "128Mi" cpu: "100m" ports: - containerPort: 9837 name: exporter env: - name: SCRAPE_PORT value: "8080" - name: SCRAPE_PATH value: total - name: SCRAPE_URL value: "http://localhost" - name: vote-api-voter image: curlimages/curl command: ["/bin/sh"] args: [ "-c", "while true; do wget -O- http://localhost:8080/votes/Lucas; sleep 3; done" ] resources: limits: memory: "128Mi" cpu: "100m"---apiVersion: v1kind: Servicemetadata: name: vote-apispec: type: LoadBalancer selector: app: vote-api ports: - port: 80 targetPort: http---apiVersion: v1kind: Servicemetadata: name: vote-api-exporterspec: selector: app: vote-api ports: - port: 9837 targetPort: exporterNow we can fetch metrics through our portal. Let’s click on Logs as we did before, and now we can search within the InsightsMetrics table using the following query:
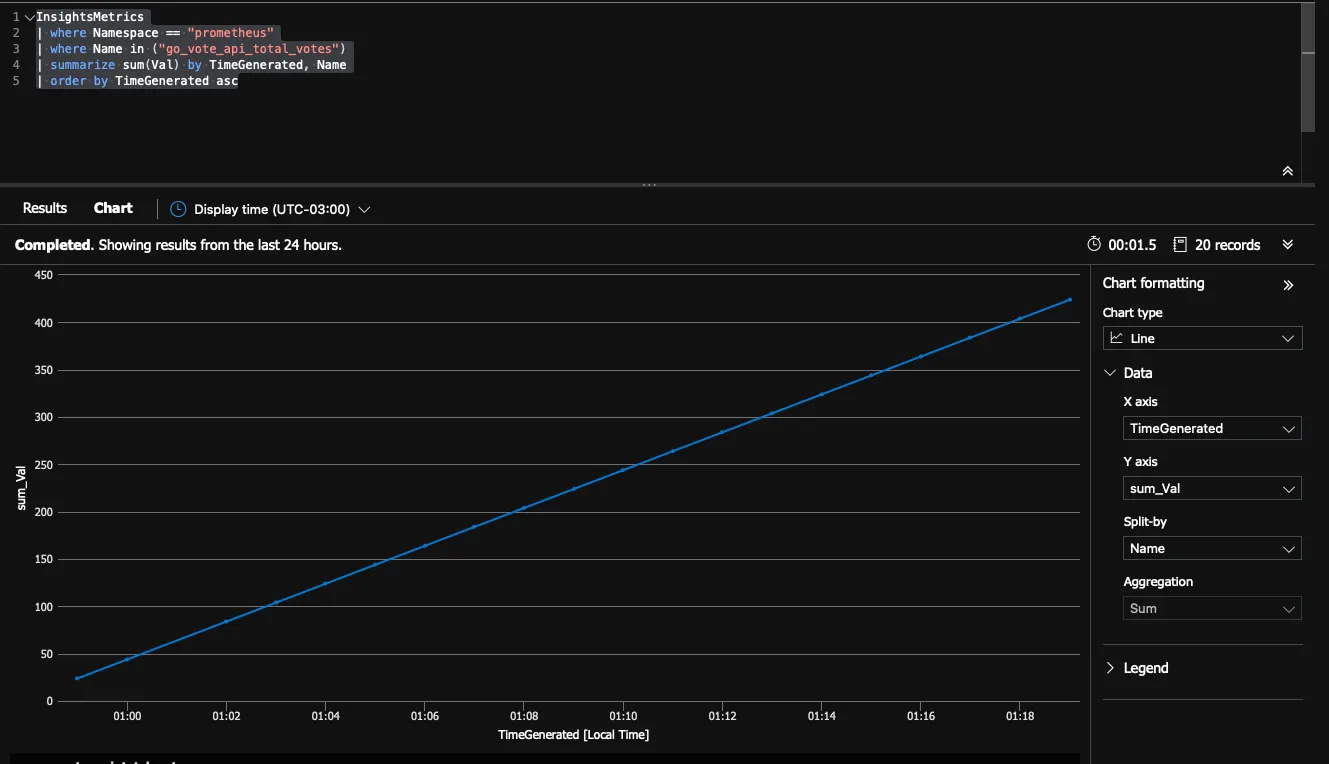
InsightsMetrics| where Namespace == "prometheus"| where Name in ("go_vote_api_total_votes")| summarize sum(Val) by TimeGenerated, Name| order by TimeGenerated ascThis will give us all the votes that were computed, separated by the time they were generated:
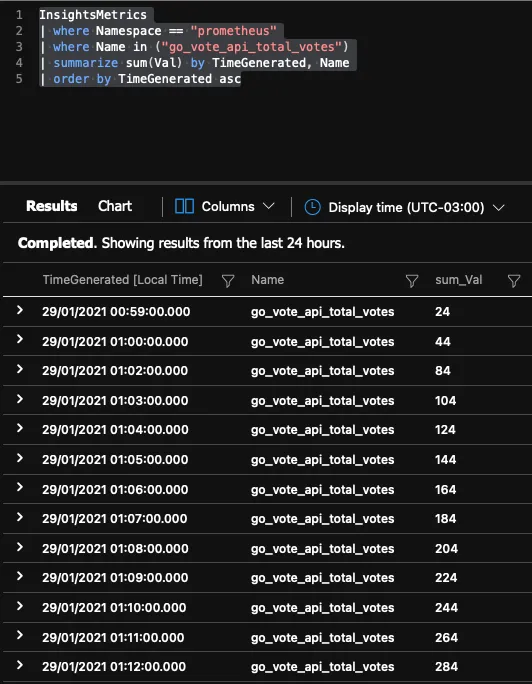
If we click on Chart, we’ll have a chart that can be configured to show the metric’s growth:
Conclusion#
Extracting metrics is important and necessary for us to have a better view of our system. With Azure Monitor, it becomes much easier to make these measurements because we don’t need to install anything external like Prometheus, and we also don’t need to manage databases or anything else.